 Thursday August 02, 2012
Thursday August 02, 2012
Thursday August 02, 2012
DevOpsDays 2012: "Event Detection" Open Space
A few weeks ago at DevOpsDays we were given the opportunity to propose topics to be discussed in the afternoon "open spaces". I was lucky enough to have my proposals chosen, on the condition that someone write a blog post to detail what was discussed during the session. This is the second of those posts...
The second discussion I facilitated was one on event detection (also known as anomaly detection). This is a project that had been started many times at Tagged, and like logging from the previous open space, there were no rock-solid recommened answers from the community. The discussion really broke along 3 different lines: thresholding, complex event correlation, and more advanced signal processing/analysis.
The overriding theme of the discussion was looking for ways to realize state changes as events. These events could trigger alerting systems and be shown as annotations in Graphite, Ganglia, etc.
Thresholding
The discussion started off around the idea of automated thresholding as a first step toward event detection. There are many examples of this, and the first one mentioned was the auto-baselining Etsy does with Holt-Winters in Graphite. For alerting, with Nagios as an example, the consensus was that individual plugins could do the thresholding themselves and even pull the data from RRD or Graphite, or be instrumented with something like ERMA . It was proposed that monitoring the derivatives was superior to simple absolute values. With something like Nagios (and presumably other systems), it could take passive checks from a CEP in addition to the thresholded alerts.
There are a number of other programs, like Reconnitor, and Edgar that have built in facilities for trending/prediction and forecasting instead of relying on individual checks to implement this themselves. This seems to be a more common feature in the industry now, with forcasting even making it into the latest versions of Ganglia-web. With these types of systems, you can do forecasting on a given set of time series data.
People we also very high on Riemann which is written in Clojure. The constructs of the Clojure language make it ideally suited for being able to perform the types of functions (combining, filtering, alerting) you would want in this kind of monitoring and alerting system. The big question people had about this system was how well it would scale vs. other approaches.
Complex Event Processing (CEP)
When discussing complex event processors, the discussion immediately fell to Esper. The idea behind Esper is that unlike a traditional database where you run your queries against stored data, with a stream processor, you run your data against your stored queries. You can define windows of time over which you would like to look for specific events. It can be run "in process" or run as its own instance. Many people were in favor of the latter approach so you did not need to restart your application when changing rules. It was also suggested that you run Esper in an active-active configuration so that when restarting, you don't lose visibility into your environment.
We spent some time discussing the history of CEPs and a few people pointed out that most of the innovation here was driven by the financial industry and a language called K). There have also been a few other CEPs in the past like SEC (simple event correlator), but as it was implemented in Perl, it had scaling problems and couldn't handle any significant loads.
We talked about the idea that a CEP could actually take many forms. Instead of having fancy algorithms for determining errors states, it could simple be as simple as the codifying of tribal knowledge so that a human does not need to sit and watch the state of the system.
We arrived at the conclusion that many had expressed at the beginning, which was that complex event processing is hard. There were only a few people in the group who had made a serious stab at it with something like Esper, and there were many that were looking for answers.
Signal Analysis
The discussion then turned to other ways of being able to detect events. Because this was a DevOps heavy crowd who was accustomed to bridging gaps between disciplines, they started looking for answers elsewhere. People started to question whether or not this was simply a digital signal processing (DSP) problem. Should we be involving data scientists, signal processors, or mathematicians? Who could help us look at a pattern over the long term to be able to detect a memory leak?
One idea was to be able to look at a baseline and apply filters to it to be able to find deviations. Someone asked that there be a blog post written describing how you could apply a filter to a stream of data to be able to show the failure.
Then John Bergman proposed an interesting idea. What if we were to make a dataset of time series data with known failures available to the academic community? A little bit like a Human Genome Project for operations failures. Would that be enough to attract interest from the academic community? The hope would be that if this data were to be made available, those same data scientists and statisticians from academia would have a large corpus upon which they could test and develop those filters and analysis tools that the DevOps community needs in order to be incorporated into our analysis systems. Much like basic auto-thresholding, and trending/prediction, are being incorporated now. In effect, this would be an extension of that same effort. We felt that in order to get a project like this off the ground, we would need a partner in the academic community who would be able to curate this collection of data in order for it to gain a critical mass of scholarly adoption.
Conclusion
Ultimately, this open space was really a confirmation of many of the concerns and fears that many who participated had already felt. Complex event processing and correlation is a hard problem, and nobody is doing it extremely well, yet. By coming at the problem from a variety of different approaches, we are getting closer all the time to something workable.
The notion of an Operations Failure Database was some great "outside the box" thinking that could bring two different yet overlapping communities together for a common purpose. If we could get enough people to contribute their data in the proper form, and enough interest from those who would like to analyze that data, there could quickly be some major advances in our currently primative tooling for this purpose.
Posted by Dave Mangot in General at 20120802
Tuesday July 17, 2012
DevOpsDays 2012: "Logging" Open Space
A few weeks ago at DevOpsDays we were given the opportunity to propose topics to be discussed in the afternoon "open spaces". I was lucky enough to have my proposals chosen, on the condition that someone write a blog post to detail what was discussed during the session. This is one of those posts...
We started out the discussion when I gave a short history about my experiences with logging over the years. It basically boiled down to the fact that there used to be a website and mailing list associated with LogAnalysis.Org (run by Tina Bird and Marcus Ranum). I remembered reading on the website or the mailing list, I don't remember which, about the fact that when you go looking for log analysis tools, you find logsurfer and swatch. Eventually you come to the realization that there are no good open source tools for this purpose, and to the conclusion that all that is left is Splunk. Unfortunately I can't find this even in the Internet Wayback Machine.
The topic of Splunk came up many, many, times during the course of our discussion. I even found it researching this blog post when I found the mailing list post by Tina Bird talking about how Splunk has graciously accepted the role as maintaining both the loganalysis mailing list, and managing loganalysis.org. Sadly or curiously, after Splunk took over managment of the domain and mailing list, they have dissappeared and the loganalysis.org domain has been taken over by a bunch of squatters. The consensus around Splunk was that it is great. I mean really great at mining the data. But there need to be more competitors in the space than just one. The pricing model for Splunk actually punishes you for being sucessful with logging and thus discourages people from doing lots of logging. This seemed wrong.
So what are the alternatives? We were lucky enough to have Jordan Sissel the author of LogStash join as as part of the discussion (he also made a pitch for this same open space). He began talking about Open Source alternatives to Splunk like Logstash, ELSA, and Graylog2. For more ideas, you can check out this Delicious Stack. He also described the problem space as being broken down into two main areas as he sees it, the Transport Problem, and the Unstructured Data problem. The group spent the rest of the time discussing each of these areas as well as a third which I'll call the Presentation Problem.
The Transport Problem
This aspect focused on the idea that it would be great to both transport and process logging data in a similar format like JSON. In fact, many projects do this sending their logs over Scribe or Flume. The nice part about this is that you can still grep through the logs even if there have been changes to the JSON fields because it does not cause a fundamental change in the log structure. Basically, it will not break your fragile regexes. Also, the logs that are sent have to make sense and have value. There is no point in sending logs over the wire for no purpose. What a lot of companies have done to ensure this, is to build standardized logging functions into their code so that each developer is not creating their own. This is an attempt to at least give some structure to the data while it is being transported so that it is easier to handle when it reaches its destination.
The Unstructured Data Problem
"Logs are messages from developers to themselves"
A topic that was brought up repeatedly revolved around the question of why each company was doing this themselves. Why are there no standards about what is logged and in what format that should be? Is there a potential to standardize some of these things? If so, how? Whose standard should we adopt? Should we choose some IITL nomencature? The purpose of this would be so that if someone logged something with a level of ERROR or WARNING or INFO, everyone would actually know what this means. The problem is that it is hard for everyone to agree on the same standard. You can call it a style guide problem, or a people problem, but it all comes down to the fact that we are currently dealing with completely unstructured data.
With all that unstructured data to be handled, you come to realize that "logging is fundamentally a data mining problem", as one of our participants commented. Even if you're able to store the data, where do you put the secondary indices? Assuming you are indexing on time, if that is even a safe assumption, what's next? Application? Log source? "What do you do with apps you don't control?" How are you going to get their data into your structured log database?
Once the data is stored, how do we know what is actionable? Project managers only know one severity, URGENT!
The Presentation Problem
"Sending a CS person Postfix logs is actively hostile"
Once you've figured out how to transport the logs and store them, the final problem is presentation. How do you create something that is consumable by different end users? The folks at Esty have come up with ways to try and make the data they are mining more meaningful. They have a standard format that allows for traceability just like Google's Dapper or Twitter's Zipkin. Getting these logs in these kinds of formats are useful is not just for developers. There was consensus that there needs to be feedback from Ops to the developers as well. Ops needs to to have ways to know what is really an error. Having first hand knowlege of this situation, where the logs are filled with errors, and we were supposed to memorize which ones were real and which could be ignored, I can safely say this was not an ideal situation. Ops also needs to be able to specify what THEY want in the logs for an app (latencies?).
"Holt Winters and standard deviation are your friends"
The final part of the presentation problem focused on what do with the data. Etsy contributed Holt Winters forecasting to the Graphite project because they felt it was so important to be able to make sense of the data you had collected. There were also suggestions to alert on rates over time, not on individual events. With all the disjointed tools out there, and the lack of any consensus of what forms logs should take, being able to present the data poses even more of a challenge.
The Future
There seemed to be a fundamental feeling within the group that the tools we have now for log transport, collection, and analysis were just not sufficient, unless you were willing to buy Splunk. Also as you can tell, the discussion raised many more questions than it did answers. But depsite that general tone to the space it was not all dour or dire. Jordan made a really big pitch for his vision of Logstash in the future. Luckly he's reiterated that same sentiment in a recent gist, so you don't have to hear it from me!
Logstash actually tackles a number of these problem areas, so the future is potentially not as dark as it seems.
- The Transport Problem
- Logstash provides the logstash log shipper which is basically logstash run with a special config file. Alternatively, there is the same idea in Python provided by @lusis.
- The Unstructured Data Problem
- This is the main problem that Logstash fixes. Logstash recognizes many common logfile formats and can translate them into the appropriate JSON. If it doesn't recognize yours, you can write your own. It can take many types of unstructured inputs, and send the now structured data to many different types of outputs. You can think of it like a neuron where the dendrites take input from multiple axons, and the axon can send the data to multiple dendrites across the synaptic cleft.
- The Presentation Problem
- Most of the time, you will send your log data into Elasticsearch (ES). Once in Elasticsearch, it can be queried using standard ES methods (e.g. REST). The is a great FOSS interface to ES called Kibana which allows you to search, graph, score, and stream your Logstash/Elasticsearch data.
The community is potentially at a turning point. Accept the juggernaut that is Splunk and live with the currently lacking status quo, or get together and change it. Which path will we choose?
Quotes in this blog post are unattributed statements made during the discussion
Posted by Dave Mangot in General at 20120717
Monday April 16, 2012
I'm speaking at Velocity 2012!
They want me to publicize it, so here goes, I'm speaking at Velocity this year. If you read my last blog post you know that I'm pretty excited about host sFlow and the amazing things it been able to do for us on our network at Tagged.
This year, Peter Phaal and I will be presenting The sFlow standard: scalable, unified monitoring of networks, systems and applications.
We'll be talking about:
- What sFlow is
- What it can do for you
- Integrating sFlow with Ganglia
- What sFlow gives you outside of your graphs
- Lots of cool examples from Tagged with real world data
If you were on the fence about attending Velocity, attend! Then, attend my talk! You can use the discount code FRIEND to get 20% off your registration. Cheers.
Posted by Dave Mangot in General at 20120416
Wednesday March 02, 2011
Back on the Blog Gang It's been about a year and a half since I last put up a blog entry. A lot has happened in that time, most notably in regards to blogging, I have a new job. After 4 awesome years at Terracotta learning about the latest in scaling technology, I moved to Tagged where I'm applying the lessons I learned every day. Tagged is the 3rd largest social network in the US and we're growing. I like to say that it's big enough where all significant failures are cascading failures. Because the environment is so large and so complex, there is lots of great stuff to blog about. So today, it's back on the blog gang, and here's to lots of great new stuff going forward. Posted by Dave Mangot in General at 20110302
Thursday February 07, 2008
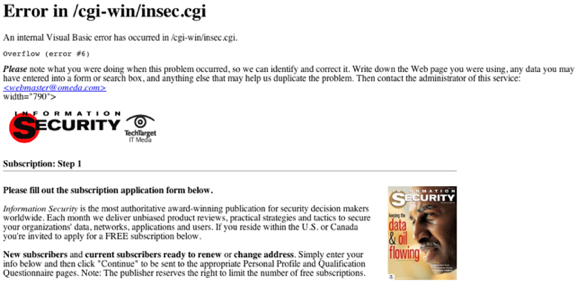
Information Security Magazine Chuckle
This made me laugh. I get a "renew your subscription" notification from Information Security Magazine even though I've only received one issue. Fair enough, it's free. I fill out their form and click submit...and I get an (buffer?) overflow in Visual Basic on some Microsoft server.
Yeah, I'm really going to trust what these guys have to say now! ")
(yes, I need a new blog template, maybe after I upgrade)
 Posted by Dave Mangot in General
at 20080207
Wednesday December 19, 2007
Posted by Dave Mangot in General
at 20080207
Wednesday December 19, 2007
A SysAdmin's impressions of MacOS Leopard
I've had the chance to use Leopard for a few weeks now on my primary work machine, a 12" G4 Powerbook. The results have been mixed. On the whole, Leopard is very good, as good as Tiger (which is excellent) but there have been a few problems being an early adopter.
The aim in this post is to cover just a few of the experiences I've had, good and bad.
The bad
- 1st boot is a BSOD!
Ok, not a real BSOD in the Windows sense but the kernel panic'd and the machine would not boot. This is a known issue and Apple has a fix. Still, it is mildly disconcerting to boot your new OS and get a big blue screen of nothing. We have a number of users on different Mac hardware and it's been very hit or miss as to who has been affected. The solution is easy, but I'd rather not see it at all.
- The X11 server is buggy
I'm not the only one who has noticed this: Boredzo.org
I've had two issues with the X11 server.
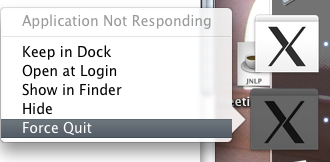
- The first is my dueling X11 dock icons. I need an X11 server to display remote X11 apps like the Terracotta admin console. In Leopard I have two icons in the dock, one that the OS thinks is in some weird state because it offers me to "Force Quit" the application. The other icon seems normal. "Force Quitting" the app has no effect incidentally, it remains. Lovely.
- While trying to use Wireshark it wouldn't start. A couple of searches and the problem turned up as a bug with X11.app discussed on the Wireshark Mailing Lists. The fix is simple, I don't care about having millions of colors in Wireshark, I'm just happy when it doesn't get my machine r00ted. Still, it worked without incident in Tiger.
- The first is my dueling X11 dock icons. I need an X11 server to display remote X11 apps like the Terracotta admin console. In Leopard I have two icons in the dock, one that the OS thinks is in some weird state because it offers me to "Force Quit" the application. The other icon seems normal. "Force Quitting" the app has no effect incidentally, it remains. Lovely.
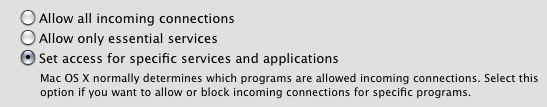
- The new firewall configuration.
This has been discussed ad naseum (trust me) on the focus-apple Securityfocus list. In 10.5.0, Apple had a setting where you could tell the OS to "Block all incoming connections". Sounds great, who doesn't like default deny? The problem was, that setting didn't block all incoming connections. Not even close. Anything that ran as root allowed incoming connections, plus anything Apple deemed essential like Rendezvous. The wording was updated for 10.5.1 to be a bit more accurate.
- X-Lite is straight up busted
We rely on Asterisk and X-lite at work so we don't have to buy all the engineers desk phones as they rarely spend too much time on the phone. Plus the USB headset makes it convenient to talk on the phone while typing. The guys over at Counterpath have basically told everyone who is using X-lite to stick it . We have bought a number of copies of Eyebeam because we've had a good experience with X-lite. I thought that was their model. I guess times are hard. The best part is they say emphatically that it is a bug with Leopard, yet my SJphone and Xmeeting work perfectly fine. Hmm.
- General bugginess and insanity
In no particular order
- My machine can't eject firewire disks, it can mount them, but you can't check out. A firewire roach motel?
- I can put my machine to sleep and once in a while, it just will not come back, reboot.
- Since upgrading to Leopard, my machine will say I have over an hour of battery life left and then shut down without warning. Checking the battery shows it is dead. I know I probably just need to zap the PRAM, but I'm usually too lazy, or too busy to do that.
- Apple filesharing gets totally confused. I mounted a drive using AFP and then tried to unmount it. The system showed the filesystem as mounted in the Filer, but it wasn't listed under /Volumes. I had to reboot to make it go away, yuk.
The good
One big annoyance with Tiger was starting up an ssh-agent(1) and it was only recognized for sessions I started in the default terminal. None of my bookmarks worked. I haven't upgraded iTerm but I have upgraded to Leopard. All of a sudden, my bookmarks recognize my ssh-agent. Sweet! iTerm is one of my favorite Mac programs, by the way. Great terminal, great support for tabs. A sysadmin essential!
Ok, someone else I know who upgraded to Leopard had trouble until he went to the latest version. Mine worked fine however, which is pretty remarkable considering it's a new kernel. I'm not sure whether to give kudos to Cisco or Apple, but in either case, I was pleasantly surprised.
Ok, I don't think this is a Leopard thing, but on every other operating system I care about, to find out what libraries are used by dynamically linked binaries, you use ldd. Not so on the Mac. I did discover that you can do the same thing with otool.
I wish I knew this when I was trying to find out if my psql Postgres client had SSL support built in! (it does)
dmangot-laptop:~ $ otool -L /sw/bin/psql
/sw/bin/psql:
        /sw/lib/libpq.5.0.dylib (compatibility version 5.0.0, current version 5.0.0)
        /usr/lib/libpam.1.dylib (compatibility version 1.0.0, current version 1.0.0)
        /usr/lib/libssl.0.9.7.dylib (compatibility version 0.9.7, current version 0.9.7)
        /usr/lib/libcrypto.0.9.7.dylib (compatibility version 0.9.7, current version 0.9.7)
        /System/Library/Frameworks/Kerberos.framework/Versions/A/Kerberos (compatibility version 5.0.0, current version 5.0.0)
        /usr/lib/libz.1.dylib (compatibility version 1.0.0, current version 1.2.3)
        /sw/lib/libreadline.5.dylib (compatibility version 5.0.0, current version 5.0.0)
        /usr/lib/libSystem.B.dylib (compatibility version 1.0.0, current version 88.1.6)
        /usr/lib/libgcc_s.1.dylib (compatibility version 1.0.0, current version 1.0.0)
Conclusion
That's it. I know that it sounds like the OS has a number of problems, but on the whole it is pretty stable and doesn't do very many things that make you say, "What?!?", unlike Windows (is wireless networking really that hard?). Like I mentioned earlier, that's the price you pay for being an early adopter. I'm sure there are a ton of people out there waiting for Vista SP1 before even trying to install that beast. With Leopard, there were very few gotchas for a dot "Oh" release, but the best part was, the upgrade hardly slowed me down. Posted by Dave Mangot in General at 20071219 Comments[2]
Friday October 19, 2007
Hello World Finally got the blogging software up and running. I'll be posting mostly about systems administration. There seems to be a dearth of people out there writing about SysAdmins and the tasks/problems/solutions they deal with every day. Hopefully I can find others who are doing the same. Maybe we'll fill the void left by SysAdmin Magazine going the way of the dodo. Posted by Dave Mangot in General at 20071019
Search This Site
Recent Entries
- DevOpsDays 2012: "Event Detection" Open Space
- DevOpsDays 2012: "Logging" Open Space
- Ode to the External Node Classifier (ENC)
- I'm speaking at Velocity 2012!
- Host-based sFlow: a drop-in cloud-friendly monitoring standard
- Graphite as presented to the LSPE Meetup 16 June 2011
- The Graphite CLI
- Back on the Blog Gang
- A framework for running anything on EC2: Terracotta tests on the Cloud - Part 1
- A Trade Show Booth: Part 2 - The Puppet Config
- Intstalling Fedora 10 on a Mac Mini
- A Trade Show booth with PF and OpenBSD
- EC2 Variability: The numbers revealed
- Linksys WET54G, a consumer product?
- Choosing Zimbra as told to ex-Taosers@groups.yahoo
- Information Security Magazine Chuckle
- A SysAdmin's impressions of MacOS Leopard
- Worlds collide: RMI vs. Linux localhost
- Hello World