 Thursday August 02, 2012
Thursday August 02, 2012
Thursday August 02, 2012
DevOpsDays 2012: "Event Detection" Open Space
A few weeks ago at DevOpsDays we were given the opportunity to propose topics to be discussed in the afternoon "open spaces". I was lucky enough to have my proposals chosen, on the condition that someone write a blog post to detail what was discussed during the session. This is the second of those posts...
The second discussion I facilitated was one on event detection (also known as anomaly detection). This is a project that had been started many times at Tagged, and like logging from the previous open space, there were no rock-solid recommened answers from the community. The discussion really broke along 3 different lines: thresholding, complex event correlation, and more advanced signal processing/analysis.
The overriding theme of the discussion was looking for ways to realize state changes as events. These events could trigger alerting systems and be shown as annotations in Graphite, Ganglia, etc.
Thresholding
The discussion started off around the idea of automated thresholding as a first step toward event detection. There are many examples of this, and the first one mentioned was the auto-baselining Etsy does with Holt-Winters in Graphite. For alerting, with Nagios as an example, the consensus was that individual plugins could do the thresholding themselves and even pull the data from RRD or Graphite, or be instrumented with something like ERMA . It was proposed that monitoring the derivatives was superior to simple absolute values. With something like Nagios (and presumably other systems), it could take passive checks from a CEP in addition to the thresholded alerts.
There are a number of other programs, like Reconnitor, and Edgar that have built in facilities for trending/prediction and forecasting instead of relying on individual checks to implement this themselves. This seems to be a more common feature in the industry now, with forcasting even making it into the latest versions of Ganglia-web. With these types of systems, you can do forecasting on a given set of time series data.
People we also very high on Riemann which is written in Clojure. The constructs of the Clojure language make it ideally suited for being able to perform the types of functions (combining, filtering, alerting) you would want in this kind of monitoring and alerting system. The big question people had about this system was how well it would scale vs. other approaches.
Complex Event Processing (CEP)
When discussing complex event processors, the discussion immediately fell to Esper. The idea behind Esper is that unlike a traditional database where you run your queries against stored data, with a stream processor, you run your data against your stored queries. You can define windows of time over which you would like to look for specific events. It can be run "in process" or run as its own instance. Many people were in favor of the latter approach so you did not need to restart your application when changing rules. It was also suggested that you run Esper in an active-active configuration so that when restarting, you don't lose visibility into your environment.
We spent some time discussing the history of CEPs and a few people pointed out that most of the innovation here was driven by the financial industry and a language called K). There have also been a few other CEPs in the past like SEC (simple event correlator), but as it was implemented in Perl, it had scaling problems and couldn't handle any significant loads.
We talked about the idea that a CEP could actually take many forms. Instead of having fancy algorithms for determining errors states, it could simple be as simple as the codifying of tribal knowledge so that a human does not need to sit and watch the state of the system.
We arrived at the conclusion that many had expressed at the beginning, which was that complex event processing is hard. There were only a few people in the group who had made a serious stab at it with something like Esper, and there were many that were looking for answers.
Signal Analysis
The discussion then turned to other ways of being able to detect events. Because this was a DevOps heavy crowd who was accustomed to bridging gaps between disciplines, they started looking for answers elsewhere. People started to question whether or not this was simply a digital signal processing (DSP) problem. Should we be involving data scientists, signal processors, or mathematicians? Who could help us look at a pattern over the long term to be able to detect a memory leak?
One idea was to be able to look at a baseline and apply filters to it to be able to find deviations. Someone asked that there be a blog post written describing how you could apply a filter to a stream of data to be able to show the failure.
Then John Bergman proposed an interesting idea. What if we were to make a dataset of time series data with known failures available to the academic community? A little bit like a Human Genome Project for operations failures. Would that be enough to attract interest from the academic community? The hope would be that if this data were to be made available, those same data scientists and statisticians from academia would have a large corpus upon which they could test and develop those filters and analysis tools that the DevOps community needs in order to be incorporated into our analysis systems. Much like basic auto-thresholding, and trending/prediction, are being incorporated now. In effect, this would be an extension of that same effort. We felt that in order to get a project like this off the ground, we would need a partner in the academic community who would be able to curate this collection of data in order for it to gain a critical mass of scholarly adoption.
Conclusion
Ultimately, this open space was really a confirmation of many of the concerns and fears that many who participated had already felt. Complex event processing and correlation is a hard problem, and nobody is doing it extremely well, yet. By coming at the problem from a variety of different approaches, we are getting closer all the time to something workable.
The notion of an Operations Failure Database was some great "outside the box" thinking that could bring two different yet overlapping communities together for a common purpose. If we could get enough people to contribute their data in the proper form, and enough interest from those who would like to analyze that data, there could quickly be some major advances in our currently primative tooling for this purpose.
Posted by Dave Mangot in General at 20120802
Tuesday July 17, 2012
DevOpsDays 2012: "Logging" Open Space
A few weeks ago at DevOpsDays we were given the opportunity to propose topics to be discussed in the afternoon "open spaces". I was lucky enough to have my proposals chosen, on the condition that someone write a blog post to detail what was discussed during the session. This is one of those posts...
We started out the discussion when I gave a short history about my experiences with logging over the years. It basically boiled down to the fact that there used to be a website and mailing list associated with LogAnalysis.Org (run by Tina Bird and Marcus Ranum). I remembered reading on the website or the mailing list, I don't remember which, about the fact that when you go looking for log analysis tools, you find logsurfer and swatch. Eventually you come to the realization that there are no good open source tools for this purpose, and to the conclusion that all that is left is Splunk. Unfortunately I can't find this even in the Internet Wayback Machine.
The topic of Splunk came up many, many, times during the course of our discussion. I even found it researching this blog post when I found the mailing list post by Tina Bird talking about how Splunk has graciously accepted the role as maintaining both the loganalysis mailing list, and managing loganalysis.org. Sadly or curiously, after Splunk took over managment of the domain and mailing list, they have dissappeared and the loganalysis.org domain has been taken over by a bunch of squatters. The consensus around Splunk was that it is great. I mean really great at mining the data. But there need to be more competitors in the space than just one. The pricing model for Splunk actually punishes you for being sucessful with logging and thus discourages people from doing lots of logging. This seemed wrong.
So what are the alternatives? We were lucky enough to have Jordan Sissel the author of LogStash join as as part of the discussion (he also made a pitch for this same open space). He began talking about Open Source alternatives to Splunk like Logstash, ELSA, and Graylog2. For more ideas, you can check out this Delicious Stack. He also described the problem space as being broken down into two main areas as he sees it, the Transport Problem, and the Unstructured Data problem. The group spent the rest of the time discussing each of these areas as well as a third which I'll call the Presentation Problem.
The Transport Problem
This aspect focused on the idea that it would be great to both transport and process logging data in a similar format like JSON. In fact, many projects do this sending their logs over Scribe or Flume. The nice part about this is that you can still grep through the logs even if there have been changes to the JSON fields because it does not cause a fundamental change in the log structure. Basically, it will not break your fragile regexes. Also, the logs that are sent have to make sense and have value. There is no point in sending logs over the wire for no purpose. What a lot of companies have done to ensure this, is to build standardized logging functions into their code so that each developer is not creating their own. This is an attempt to at least give some structure to the data while it is being transported so that it is easier to handle when it reaches its destination.
The Unstructured Data Problem
"Logs are messages from developers to themselves"
A topic that was brought up repeatedly revolved around the question of why each company was doing this themselves. Why are there no standards about what is logged and in what format that should be? Is there a potential to standardize some of these things? If so, how? Whose standard should we adopt? Should we choose some IITL nomencature? The purpose of this would be so that if someone logged something with a level of ERROR or WARNING or INFO, everyone would actually know what this means. The problem is that it is hard for everyone to agree on the same standard. You can call it a style guide problem, or a people problem, but it all comes down to the fact that we are currently dealing with completely unstructured data.
With all that unstructured data to be handled, you come to realize that "logging is fundamentally a data mining problem", as one of our participants commented. Even if you're able to store the data, where do you put the secondary indices? Assuming you are indexing on time, if that is even a safe assumption, what's next? Application? Log source? "What do you do with apps you don't control?" How are you going to get their data into your structured log database?
Once the data is stored, how do we know what is actionable? Project managers only know one severity, URGENT!
The Presentation Problem
"Sending a CS person Postfix logs is actively hostile"
Once you've figured out how to transport the logs and store them, the final problem is presentation. How do you create something that is consumable by different end users? The folks at Esty have come up with ways to try and make the data they are mining more meaningful. They have a standard format that allows for traceability just like Google's Dapper or Twitter's Zipkin. Getting these logs in these kinds of formats are useful is not just for developers. There was consensus that there needs to be feedback from Ops to the developers as well. Ops needs to to have ways to know what is really an error. Having first hand knowlege of this situation, where the logs are filled with errors, and we were supposed to memorize which ones were real and which could be ignored, I can safely say this was not an ideal situation. Ops also needs to be able to specify what THEY want in the logs for an app (latencies?).
"Holt Winters and standard deviation are your friends"
The final part of the presentation problem focused on what do with the data. Etsy contributed Holt Winters forecasting to the Graphite project because they felt it was so important to be able to make sense of the data you had collected. There were also suggestions to alert on rates over time, not on individual events. With all the disjointed tools out there, and the lack of any consensus of what forms logs should take, being able to present the data poses even more of a challenge.
The Future
There seemed to be a fundamental feeling within the group that the tools we have now for log transport, collection, and analysis were just not sufficient, unless you were willing to buy Splunk. Also as you can tell, the discussion raised many more questions than it did answers. But depsite that general tone to the space it was not all dour or dire. Jordan made a really big pitch for his vision of Logstash in the future. Luckly he's reiterated that same sentiment in a recent gist, so you don't have to hear it from me!
Logstash actually tackles a number of these problem areas, so the future is potentially not as dark as it seems.
- The Transport Problem
- Logstash provides the logstash log shipper which is basically logstash run with a special config file. Alternatively, there is the same idea in Python provided by @lusis.
- The Unstructured Data Problem
- This is the main problem that Logstash fixes. Logstash recognizes many common logfile formats and can translate them into the appropriate JSON. If it doesn't recognize yours, you can write your own. It can take many types of unstructured inputs, and send the now structured data to many different types of outputs. You can think of it like a neuron where the dendrites take input from multiple axons, and the axon can send the data to multiple dendrites across the synaptic cleft.
- The Presentation Problem
- Most of the time, you will send your log data into Elasticsearch (ES). Once in Elasticsearch, it can be queried using standard ES methods (e.g. REST). The is a great FOSS interface to ES called Kibana which allows you to search, graph, score, and stream your Logstash/Elasticsearch data.
The community is potentially at a turning point. Accept the juggernaut that is Splunk and live with the currently lacking status quo, or get together and change it. Which path will we choose?
Quotes in this blog post are unattributed statements made during the discussion
Posted by Dave Mangot in General at 20120717
Wednesday May 23, 2012
Ode to the External Node Classifier (ENC)
![]()
External Node Classifier, how do I love thee? Let me count... There has been a great deal of attention lately being paid to the backends that are available in my current configuration management tool of choice, Puppet. I'm sure Chef must have some similar types of constructs. The buzz is about Hiera, which is a pluggable hierarchical database for Puppet. Which means that when Puppet is looking up information about a node, it can look in multiple places. I think this is a great idea, and at Tagged we have been using something similar that we are in love with for a few years, the External Node Classifier (ENC).
What the ENC allows us to do is make a call to our centralized management database (CMDB) for each host that calls in for Puppet configuration. We return a bit of YAML from our Perl script, and Puppet uses that information to configure the node. Click on the link above to find out more about how it works. The powerful thing about this mechanism, is that we can return almost anything we want for Puppet to use. Each variable that we return in the YAML can be used as an actual variable in our Puppet manifests. This is what's so amazing about the ENC, it allows us to organize our network of hosts however we want it, with almost no preconceived notions of what we are going to want to build next (within reason of course).
---
classes:
  - web
environment: production
parameters:
  SpecId: 6
  appType: web
  cabLocation: 98b
  cageLocation: 34
  consolePort: 19
  cores: 8
  cpuSpeed: 2.53GHz
  ganglia_cluster_name: Web
  ganglia_ip: 172.16.11.34
  ganglia_ip2: 172.16.11.35
  ganglia_port: 8670
  gen: 4
  portNumber: 19
  vendor: Dell
Sure we could pre-allocate large chunks of the network for web servers, and another chunk for security services. But what if we guess wrong? What if they don't all fit into a /24, or a /23. What if we allocate a /28 but it turns out we need a /25? This is a problem. It gets worse if you consider that you actually don't want your memcached servers to be in a different subnet than your web servers. In a datacenter environment, latency is important, and layer 2 is the only way to go for some applications. Routing will kill you.
So, what to do? Enter the ENC. Our ENC returns lots of information, but at a high level, it returns our Puppetclass and what we call an AppType, which is like a subclass. For example, the Puppetclass may be web and the AppType imageserver. Now, I can actually slice my hosts any way I want to. The same group of engineers should be able to login to the imageserver hosts? No problem, distribute an access control file based on AppType. All the imageservers should get the same Apache configuration? Again, not a problem. If an imageserver and a PHPserver are in sequential IPs, it does not matter. If they have a memcached host situated on an IP in between? Again, not a problem. Puppet will take care of ensuring each host gets the proper configuration.
But it actually get's better. Using the ENC, we can actually group hosts any way that we imagine. One thing we use very heavily at Tagged is Ganglia. Very simply, we could map Ganglia clusters to AppTypes. We don't even need to simply return the AppType, we could actually return the Ganglia configuration for each host and plug that into a Puppet ERB template. This is where it gets interesting. We actually combine multiple AppTypes into Ganglia clusters in some cases. For example, our security group has all kinds of different applications that they use to keep our users safe and secure. Some are on one server, some are on many, but it is very unlikely that our security group needs to get a large "cluster-wide" view of an application tier. Very often they are looking at the performance of individual hosts. If we were segmented by IP address, we would have to guess how many applications they would develop over some arbitrary time period. If we were segmented purely on AppType, we might have 10 different Ganglia clusters with one or two hosts each.
But because of the power of the External Node Classifier, we can actually slice and group our network of hosts any way that we choose, in ways that serve our purposes best. When we changed from collecting our system information from Ganglia gmond to Host sFlow, it was literally a change to a few variables and templates, and within 30 minutes, we had a completely different monitoring infrastructure. It was that simple.
If you haven't looked at the more capable backends to Puppet or your current configuration management tool of choice, you should. Just like "infrastructure as code", a little up front hacking, goes a long, long way.
Posted by Dave Mangot in Applications at 20120523
Monday April 16, 2012
I'm speaking at Velocity 2012!
They want me to publicize it, so here goes, I'm speaking at Velocity this year. If you read my last blog post you know that I'm pretty excited about host sFlow and the amazing things it been able to do for us on our network at Tagged.
This year, Peter Phaal and I will be presenting The sFlow standard: scalable, unified monitoring of networks, systems and applications.
We'll be talking about:
- What sFlow is
- What it can do for you
- Integrating sFlow with Ganglia
- What sFlow gives you outside of your graphs
- Lots of cool examples from Tagged with real world data
If you were on the fence about attending Velocity, attend! Then, attend my talk! You can use the discount code FRIEND to get 20% off your registration. Cheers.
Posted by Dave Mangot in General at 20120416
Tuesday November 01, 2011
Host-based sFlow: a drop-in cloud-friendly monitoring standard

Everyone who is a professional sysadmin knows that part of the excitement and drain of our jobs, is keeping track of all the different technologies out there, how and what to add to our toolbox, and what's coming next.
Sometime we are lucky enough to bump into an old friend that has grown and matured over the years. I'm talking about technology, and in this case, sFlow. I used a number of Foundry (now Brocade) switches at different companies over the years and they all implemented sFlow. I would send all my sFlow data to various different collectors at different jobs, and was constantly amazed at the power and versatility of this technology.
One of the things in which sFlow really excels in the network space is doing things like showing you the "top talkers" on a network segment. It does this by sampling the packet stream and allowing you to see what it sees. This is much more efficient than trying to capture every packet. When you are able to adjust the amount of sampling you do based on the packet count you experience, you are able to handle much larger volumes of traffic with a high degree of confidence in your data. I always thought that it would be great if I could get this level of visibility on my application tier, and now I can.
The sFlow community has been making great strides with Host sFlow which takes some of the same great characteristics from the network sFlow standard and applies them on the host and application side. This means that you can actually find out which URLs are being hit the most, which memcache keys are the hottest, and how that correlates with what you are seeing on the network.
Setup
Setting up host-flow could not be much easier. First, you can download packages for FreeBSD, Linux, or Windows from the SourceForge Site. Once installed, when you start the daemon; on Linux, it will check /etc/hsflowd.conf to find out where the sFlow collector(s) are located. This is where the daemon will send all the data. You can also set things like polling and sampling rates in this file. If you wish, you may also define these using the location services in DNS. That's it.
You will also need a collector. The simplest collector is sflowtool which will capture the packets and present them to you in various formats all of which are consumable by your favorite scripting language. There are many collectors to choose from. At Tagged one of our favorite collectors is Ganglia!.
As of Ganglia 3.2, it can understand and process sFlow packets. At Tagged, we have replaced all of our gmond process with hsflowd.
Efficiency
One of the great things about replacing our gmond processes is that our monitoring infrastructure is now much more efficient. With gmond, every metric that you measure sends a packet across the wire. If you sample every 15 seconds, it simply sends a packet every 15 seconds, for each metric that you monitor. With hsflowd, you can sample every 15 seconds, but hsflowd will batch all those metrics up into a single packet and send those across the wire. We are actually able to collect more metrics, more often, with less packets. On a big network like Tagged, anything we can do to lower our packets per second is a big win. The difficult part was converting from multicast which a trivial setup to unicast. We took it as an opportunity to templatize all our puppet configs for this purpose based on our CMDB. Now we have a system that we really love.
A Standard, Really
Perhaps one of the things that was most challenging to wrap our heads around is that sFlow is not a replacement for our Ganglia or Graphite tools. sFlow is a standard on switches and it's a standard on the host side too. That does not mean that you cannot instrument your own applications with sFlow. It means that this is not the default configuration for sFlow. It means that if you are going to look at your HTTP metrics whether they come from Apache, Nginx, or Tomcat, they are going to be the same metrics.
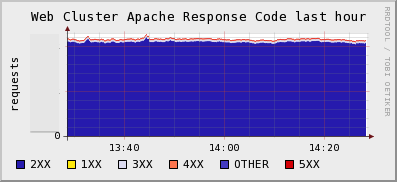
If you want to monitor things like the number of active users on your site, you can still do those things with gmetric or graphite. However if you want to be able to find out how many of your HTTP requests have 200, 300, or 500 response codes, and you want to be able to do that in real-time across a huge web farm ( which makes log analyzers and packet sniffers completely impractical) then you want mod-sflow (for Apache).
Solves The Java JMX Problem
There are a few other things that have me excited about sFlow. One, is that it solves the JVM monitoring problem. Ops folks always want to know how their Tomcat or JBoss servers are running. You can buy fancy tools from Oracle to do this, or you can use the jmx-sflow-agent. Typically, the way we solve this problem is that we either fire up a tool like check_jmx which basically fires up a JVM each and every time it needs to check a metric *shudder*, or we run a long running java process that we need to constantly update with a list of servers to poll in order to get graphs of our heap sizes.
Alternatively you could run jmx-flow-agent which runs as a -javaagent argument to the jvm command line and have all your JVMs automatically send their metrics to a central location the moment they start.
Cloud-Friendly
That's the thing. When applications start up, they start sending their data via sFlow to a central location for you. There is no polling. This is the same model as all the next generation of monitoring tools like Ganglia and Graphite. This is cloud-friendly.
Imagine you were Netflix running thousands of instances on EC2. Would you rather have to update your config file every few seconds to make your monitoring systems aware of all the hosts that have been provisioned or destroyed, or would you like new hosts to just appear on your monitoring systems as the hosts appear? At Tagged, we would be constantly updating our config files every time a disk failed, or when a tier was expanded or a new one provisioned. We would have to specify in the file, which hosts were running Java, or Memcache or Apache, or both.
Instead, in our world, if an application is running on a host, we see that application in our monitoring tools, instantly. Deploying mod-sflow to your apache servers was as simple as creating an RPM and putting a few lines in Puppet. Awesome.
The Future
sFlow's relationship with the host side of the equation is just picking up steam now. We've been lucky enough to be at the leading edge of this, mostly through my giving my LSPE Meetup Talk at on the right day, at the right time. In the coming weeks, we hope to share more with the world what we're getting from using sFlow on our network, why we are loving it, and what problems it's helped us to solve.
Posted by Dave Mangot in Applications at 20111101 Comments[2]
Tuesday June 21, 2011
Graphite as presented to the LSPE Meetup 16 June 2011 My talk at the LSPE Meetup.[Read More] Posted by Dave Mangot in Applications at 20110621
Wednesday March 02, 2011
As part of working on a large scale website like Tagged we are constantly exploring new technologies to see what might be advantageous to help with the site. Whether it's exploring NoSQL technologies, new storage or server hardware, or visualization tools, there is no shortage of software and hardware to try.
Recently, we've been trying out the Graphite Realtime Graphing system. It started as an experiment during our latest Hackathon, and the more we've tried it, the more things there are to like. Because the current Graphite documentation doesn't include a CLI tutorial, I thought it might be nice to write one.
One of the first things you notice when using Graphite is how powerful
and flexible its graphing system is. Sometimes I feel like Tom
Cruise in the "Minority Report" being able to have complete control
over the way I manipulate and visualize my data. One of the great
things (I guess if you're a Unix geek) about Graphite is that it also
comes with a CLI.
To access the CLI, simple point your browser at
http://yourgraphiteinstall/cli or just click the link on the top of
the regular composer window. You will be presented with a prompt like
this:
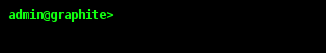
If you haven't logged in yet (here I am logged in as "admin"), simply
type 'login' at the command prompt and you will be taken to a screen
where you can login to Graphite. Without being logged in, we will be
unable to save our views, which we will get to a bit later.
While we can simply begin drawing graphs, right inside the actual
cli, I prefer to draw them inside windows. This way, if you create
multiple windows and save them as a view, you can move them around,
resize them, etc, independently of one another. To create a new
window, type 'create windowname' and it pops up on your screen:
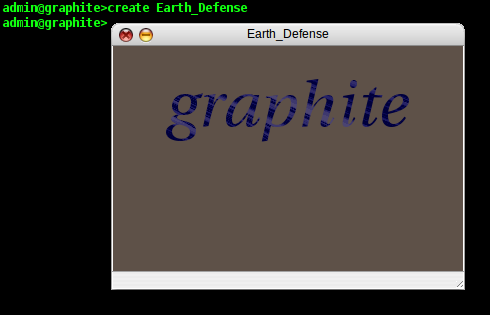
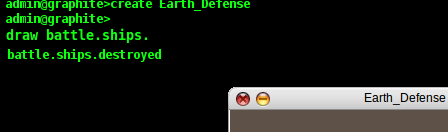
Now we have somewhere to plot our data. For the purposes of this
tutorial, we have populated our datastore with some fictionalized data
about some Earth defense stations that are using their lasers to blast
invading ships out of the sky. Now we are going to plot how the
individual stations are doing. In reality, this data can be anything
that you can get into Graphite (networking data, number of users on a
site, temperature, stock prices, etc). In the CLI, I type 'draw
battle.ships.' and as I type, Graphite automatically shows me below
the cursor all the possible completions for my namespace as I
type:
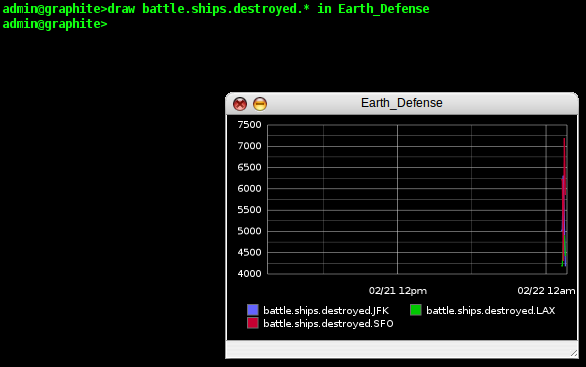
One of the nice things about using a CLI is that I can use
wildcards, so for this example, I type 'draw battle.ships.destroyed.*
in Earth_Defense' and Graphite shows me my data in the window on a
smart looking graph. It has automatically matched all the different
parts of my namespace and plotted them individually on the graph (in
this case, SFO, JFK, and LAX).
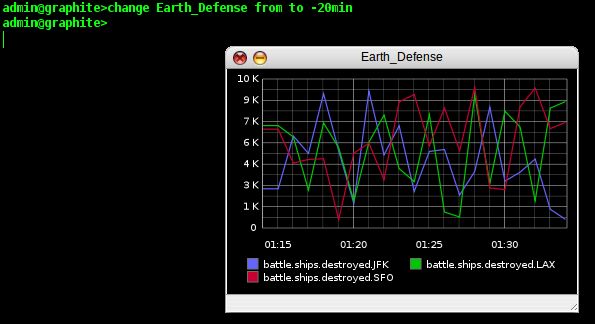
That's pretty nice, but it's difficult to see how the individual
battle stations are doing because we've only recently been getting our
reports in from the stations. So, we need to change the timescale of
our graph. In the CLI, this is trivially easy. We type 'change
Earth_Defense from to -20min' and the timescale on our window is
updated instantly.
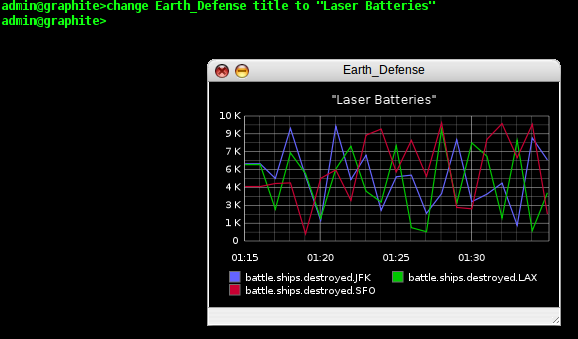
If we are going to send these reports to our superiors, they might
not be as tuned into our data collection methods as we are, so let's
add a title to our graph. We type 'change Earth_Defense title to
"Laser Batteries"' and Graphite updates our graph once again.
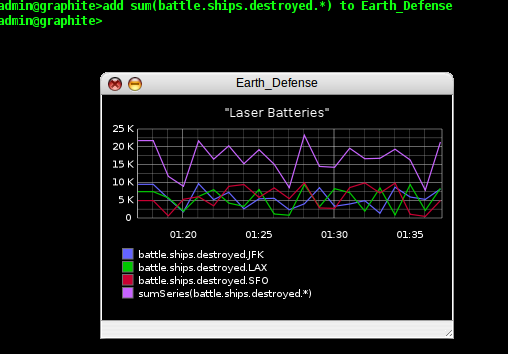
That is just one example of a way we can manipulate a graph in the
CLI, but in reality, we can not only change the chrome of our graph,
but also work with the data itself. Maybe the generals in charge our
our battle don't care about the individual battle stations, they want
to know about the total number of ships destroyed minute by minute.
So let's give them a total they can see on the graph. We type 'add
sum(battle.ships.destroyed.*) to Earth_Defense' and our total
kills now appears on the graph:
There are lots more things we can do with the CLI, and many more
manipulations we can do on our graphs, but for now, we want to be able
to save our graph, so that we can return to it later. In the CLI
this is called a "view". You can have multiple windows/plots saved
in a view, but we are going to save our view now by typing 'save
laserreport'.
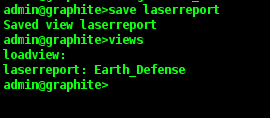
If at some point in the future, we wanted to get this report back, we
could simple type 'views' to get a list of all the different
saved views, followed by 'load viewname' to actually retrieve
the report.
Of course having an easy to use CLI like graphite also allows us to do other powerful things. Having a CLI is almost like having a basic API, so we can actually script what we will cut and paste into our CLI in order to automate repetitive actions. We'll use this Ruby script as a basic example.
#!/usr/bin/ruby

graphite = { "Apple" => "AAPL", "Google" => "GOOG", "Visa" => "V" }
graphite.each { |key, value| puts "create #{key}\ndraw stocks.#{value} in #{key}\n" }
Here we take a hash with information about our window titles and iterate through a list of stock quotes we have in our Graphite installation. You can imagine the possibilities this can give you. Here's the output:create Visa draw stocks.V in Visa create Google draw stocks.GOOG in Google create Apple draw stocks.AAPL in Apple
Graphite is an exciting tool that is becoming easier to use and more capable with every release. Currently we're trying to see how it compares to the tools that we have internally (like you can see here). There are a number of compelling attributes to both tools and it may be the case that one tool will not be the best fit for all cases. In the few short weeks we've been experimenting with Graphite, at the very least, it's proven to be a great addition to the sysadmin's toolbox.
Posted by Dave Mangot in Applications at 20110302 Comments[2]Back on the Blog Gang It's been about a year and a half since I last put up a blog entry. A lot has happened in that time, most notably in regards to blogging, I have a new job. After 4 awesome years at Terracotta learning about the latest in scaling technology, I moved to Tagged where I'm applying the lessons I learned every day. Tagged is the 3rd largest social network in the US and we're growing. I like to say that it's big enough where all significant failures are cascading failures. Because the environment is so large and so complex, there is lots of great stuff to blog about. So today, it's back on the blog gang, and here's to lots of great new stuff going forward. Posted by Dave Mangot in General at 20110302
Monday August 17, 2009
A framework for running anything on EC2: Terracotta tests on the Cloud - Part 1 A framework for running Terracotta (or any other) software on EC2[Read More] Posted by Dave Mangot in Applications at 20090817 Comments[3]
Tuesday August 04, 2009
A Trade Show Booth: Part 2 - The Puppet Config After writing the blog post about running a trade show booth with OpenBSD and PF, a few people asked about the puppet configuration. The configuration is actually dead simple. The idea is to configure the machines with the base configuration they need, as well as provide for future management. Because this is such a simple environment, we are able to keep the flexibility of both configuration management coupled with instantaneous change. The best way to understand this is just to have a look at the site.pp.
import "classes/*.pp"

node default {
        include rootssh
        include tchomedir
        include postfix
        include mysql
}
Let's look at each file in turn
rootssh
class rootssh {
  file { "/root/.ssh":
        owner => root,
        group => root,
        mode => 700,
        ensure => directory
        }
  file { "/root/.ssh/authorized_keys":
        owner => root,
        group => root,
        mode => 700,
        content => "ssh-dss AAAAB...truncated...N==",
        require => File["/root/.ssh"]
        }
}
I know there is a puppet directive to handle ssh keys but it doesn't work, at least it didn't in my setup. Using 'content' to the 'file' type works well. This enables the puppetmaster (OpenBSD box) to control all the puppet hosts as root. Turns out we didn't need to use this very much but it's handy to have nonetheless.
tchomedir
class tchomedir {
  file { "/home/terracotta/terracotta":
        owner => terracotta,
        group => terracotta,
        ensure => "./terracotta-3.1.0-beta.jun2",
        }
  file { "/home/terracotta/examinator":
        owner => terracotta,
        group => terracotta,
        ensure => "./examinator-cache-1.2.0-SNAPSHOT.jun2",
        }
  file { "/home/terracotta/Destkop/Demo.Deck.Simple.2.2.pdf ":
        owner => terracotta,
        group => terracotta,
        mode => 755,
        name => "/home/terracotta/Desktop/Demo.Deck.Simple.2.2.pdf",
        source => "puppet:///dist/Demo.Deck.Simple.2.2.pdf"
        }
  file { "/home/terracotta/.bashrc":
        owner => terracotta,
        group => terracotta,
        ensure => present,
        source => "puppet:///dist/bashrc"
        }
}
We already had the terracotta user and group created, though this could have been easily done in puppet, maybe next year. Here we make sure that the "terracotta" and "examinator" symlinks are always pointing to the right kits. We distribute a PDF file used for the demos, and make sure everyone has the same centrally configured .bashrc
postfix
class postfix {
  package { "postfix":
        name => postfix,
        provider => apt,
        ensure => present
        }
  file { "/etc/postfix/main.cf":
        owner => root,
        group => root,
        source => "puppet:///dist/main.cf"
        }
  service { "postfix-svc":
        ensure => running,
        subscribe => File["/etc/postfix/main.cf"],
        require => Package["postfix"],
        name => postfix
        }
}
Pretty simple and demonstrates what is pretty awesome about puppet. This definition retrieves and installs postfix, gets the postfix configuration from the puppetmaster and makes sure postfix is running. It will even reload the postfix configuration if the main.cf on the puppetmaster changes.
mysql
class mysql {
  file { "/etc/init.d/mysql":
        owner => root,
        group => root,
        source => "puppet:///dist/mysql"
        }
  service { "mysql-svc":
        ensure => running,
        subscribe => File["/etc/init.d/mysql"],
        name => mysql
        }
}
Here we could have used puppet to install mysql just like we did for postfix, but it is already on there from the machine build. We replace the init script for mysql with our own with some custom arguements and then make sure the service is running.
Distributing the Terracotta kits
To distribute the Examinator and Terracotta kits we used prsync in the PSSH kit by Brent Chun. It can run a command, sync over rsync, etc. to 32 machines over ssh in parallel by default, and more if configured that way. With this we ran a single prsync command that distributed out each directory to all the machines at the same time whenever we needed to update the kit.
Questions
So there are two questions that might be asked about this configuration.- Why aren't you using puppet to distribute the kits?
- Prior to the new Puppet 0.25 RC just released with the beginnings of a move toward REST from XML-RPC, puppet has been terrible at recursively copying large directory trees. We tried to distribute the Terracotta kit with all its directories and jars and it blew up running out of file descriptors. The is reportedly fixed in the RC mentioned above.
-
Why are you using prsync instead of puppetrun?
- Because we couldn't use puppet to distribute the kits so triggering the run can only be used to shift the symlink. We could have used an exec directive in the puppet config to pull the file from somewhere and untar it but that seems no less hackish.
Summary
Using puppet definitely makes our lives easier when setting up a trade show booth. This is the first year we've used puppet and I've already learned a lot about the tool and will be using it even more extensively next year to separate the OS install, from the booth dependencies (e.g. mysql). See you at JavaOne!
Posted by Dave Mangot in Applications at 20090804
Tuesday July 28, 2009
Intstalling Fedora 10 on a Mac Mini
I was on an interview once and the interviewer asked me what kind of Unix I run outside of work. I thought this was an excellent question and one that I often use myself when hiring sysadmins. With few exceptions, the people who are enthusiastic enough to have a machine at home that they can play with and learn from tend to make the best sysadmins.
I responded that I love to run operating systems on "exotic" hardware. I've run OpenBSD on both a Sun IPC and SparcStation 20 (with a 150 MHz Hypersparc processor mind you!) and am currently running it on a Soekris Net4801. I'm also running Fedora on a Mac Mini.
At Terracotta we needed some extra machines for a project I'm working on (very hush, hush ") ), so I decided to drop Fedora 10 on 2 Mac Minis we have that are currently unused. It was not without it's tricks however, even though we have a pretty nice Kickstart setup which configures everything, including Puppet.
), so I decided to drop Fedora 10 on 2 Mac Minis we have that are currently unused. It was not without it's tricks however, even though we have a pretty nice Kickstart setup which configures everything, including Puppet.
Here are the steps:
- Boot the Mac from an installer CD and open up the Disk Utility
- Partition the drive to have 1 partition and under Options, choose MBR (master boot record)
- Install Fedora 10 as normal
- Boot up and find out that your machine won't take a DHCP address (arrrgggh!)
- sudo yum -y erase NetworkManager
- sudo /sbin/chkconfig network on
- sudo reboot
For some reason I have yet to understand, the folks at Fedora and many other Linux distributions have this notion that everyone want to run Linux as a desktop. While I do like my Ubuntu desktop (running on a boring PC), I have much more need for servers in my day job. Why Fedora seems to default to a desktop configuration is beyond me. (NetworkManager is for managing a desktop's network configuration). After I turned on networking, everything behaved as normal.
Believe it or not, people actually do run Fedora on servers even though it's very frustrating to have to upgrade every 6 months. Maybe I'm used to it from the OpenBSD release cycle I've been following since OpenBSD 2.5. The reason we use it is at a "cutting edge startup" like Terracotta the developers like to have the latest everything (ruby, svn, etc.) and running on Fedora allows us to provide those things through the regular package management tools (in this case, yum) that come with the system. No need to search all over the Internet for RPMs or build our own, we have enough to do.
Posted by Dave Mangot in Hardware at 20090728
Tuesday June 23, 2009
A Trade Show booth with PF and OpenBSD
A few months after I started at Terracotta I attended my first JavaOne conference. Not as an attendee, but as an exhibitor. The boss came and asked me to build up some infrastructure to run a booth. Over the years, the setup of the booth and some of the software and equipment has changed, but the primary design principles have not.
- Allow all machines in the booth to share a single Internet connection
- Make it simple to setup and use
- Allow employees to check their email, etc. from the booth
- Allow the sales engineers to explore potential client websites
- Do not allow demo stations to be used by conference attendees to check their email or hog the demo station trying to show us their website
- Make it secure so that we don't have any demo "surprises"
- Make sure all the demo stations are consistent
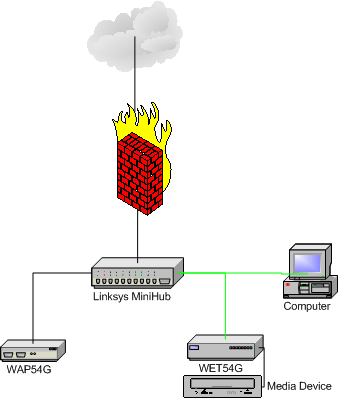
I turned to one of my favorite operating systems to solve the problem, OpenBSD. Here is what the network looks like as of 2009.
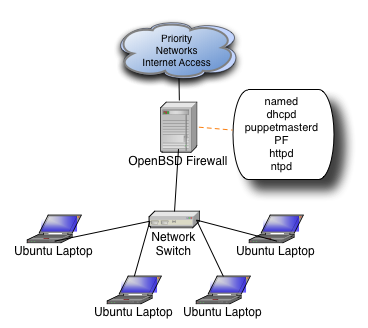
We get our Internet connection from Priority Networks and every year it is rock solid, they are super easy to work with, and when you need help, they actually know what you're talking about!
As you can see, each daemon on the machine serves a purpose to running the overall network. Each daemon (other than PF) is only assigned to the internal interface.
- named
- We run a private domain inside the booth (javaone.tc) and also need standard resolving for internal clients
- dhcp
- Demo machines are given static IPs, all other clients are assigned to a different part of the subnet, more on this later
- puppetmasterd
- Now that machines have gotten faster and we have less graphical demos, we can run all Unix demo stations. Puppet makes sure all the machines are 100% consistent and makes it much easier to setup machines initially or substitute in a new station in case of some kind of problem
- PF
- This is where all the magic happens, why you can type www.yahoo.com and wind up at Terracotta.org
- httpd
- This was more important before puppet and when we still had Windows, but Apache is still a great way to serve up files to any network
- ntpd
- We're a Java clustering company and it's very important to have synchronized clocks in a cluster, then again, isn't it always?
As you can see above, we have a private domain inside the booth. It's just a simple /24 divided in two. Machines in the lower half of the subnet are assigned static IPs by MAC address, this is for the demo stations only. Machines in the top half of the subnet (129-254) are assigned IPs dynamically and this range is for any employee who brings their laptop to the booth and wants to login to check email, fix a bug, etc. PF treats the two IP ranges differently.
Here is the firewall ruleset:
ext_if="bge0"
int_if="dc0"
DEMOSTATIONS="192.168.100.0/25"
EMPLOYEES="192.168.100.128/25"

set skip on lo
# allow demo stations to access Terracotta and a few other websites we rely upon
table <TCOK> { 64.95.112.224/27, www.google-analytics.com, now.eloqua.com, secure.eloqua.com,  download.terracotta.org }
scrub all

nat-anchor "ftp-proxy/*"
rdr-anchor "ftp-proxy/*"
nat on $ext_if from $int_if:network -> ($ext_if:0)
rdr pass on $int_if proto tcp from $int_if:network to port 21 -> 127.0.0.1 port 8021
rdr pass on $int_if proto tcp from  $DEMOSTATIONS to ! <TCOK> port 80  -> 64.95.112.233  port 80
rdr pass on $int_if proto tcp from  $DEMOSTATIONS to ! <TCOK> port 443  -> 64.95.112.233  port 80

anchor "ftp-proxy/*"
block log all

pass quick on $int_if no state
antispoof quick for { lo $ext_if }

# fw inbound - for remote admin when Priority Networks allows this
pass in quick on $ext_if proto tcp to ($ext_if) port ssh

# fw outbound
pass out quick on $ext_if proto tcp from ($ext_if) to any modulate state flags S/SA
pass out quick on $ext_if proto udp from ($ext_if) to any keep state

# int outbound
pass in quick proto tcp from $DEMOSTATIONS  to any port { 22 25 80 443 8081 } modulate state flags S/SA
pass in quick proto udp from $DEMOSTATIONS  to any port { 53 } keep state
pass in quick proto tcp from $EMPLOYEES to any modulate state flags S/SA
pass in quick proto udp from $EMPLOYEES to any keep state
The only problem with this ruleset is that the name resolution for domains that are hardcoded in the ruleset (e.g. www.google-analytics.com) can only really happen after the OS has booted. Otherwise, the boot sequence stalls on name resolution. The workaround for this is to disable PF in /etc/rc.conf.local and enable it with
pfctl -e -f /etc/pf.confin /etc/rc.local. That is really the only necessary workaround.
As you can see, it's actually a REALLY, REALLY permissive ruleset. Much more permissive than we allow in the office. Because there is rarely a Terracotta sysadmin on the show floor during the conference, and because there are tons of open access points which our employees would use if we locked them down too much anyway, we feel this is a pretty acceptable level of risk for the few days of the show. We could certainly lock down the ports employees could access, restrict to their MAC addresses, or even put in authpf for them to authenticate, but that would mean maintaining a password file outside the corporate office, or duplicating the LDAP server, or setting up an IPSEC tunnel, all of which are excessive for a few days of conference.
That's really all there is to it (other than some GENERATE statements in the zone files). Free, functional, easy, and secure by OpenBSD. Posted by Dave Mangot in Applications at 20090623 Comments[3]
Wednesday May 13, 2009
EC2 Variability: The numbers revealed
Measuring EC2 system performance
I've been spending a lot of time at Terracotta working on cloud deployments of Terracotta and the cloud in general. People have been asking me what the difference is running apps on the cloud, and specifically EC2. There are a number of differences (m1.small is a uni-processor machine!) but the number one answer is "Variability". You just cannot rely on getting a consistent level of performance in the cloud. At least not that I've been able to observe.
I decided to put EC2 to the test and examine three different areas that were easy to measure: disk I/O, latency, and bandwidth
Disk I/O
- Environment: EC2 m1.small
- File size: 10 MB (mmap() files)
- Mount point: /mnt
- Testing software: iozone
- Duration: almost 24 hours

As you can see the numbers can vary a good deal. This is on an otherwise completely quiescent virtual machine and with a 10 MB filesize, the tests themselves took almost no time to run. Most of the numbers actually look remarkably consistent with the exception of Random Reads. Those numbers are all over the place which you might expect from "random" but this looks to be a bit much. The numbers are actually pretty respectable and compare to about a 7200 RPM SATA drive. Certainly not the kind of machine you would use for performance benchmarks, but if you threw enough instances at a clustering problem, you could certainly get the job done.
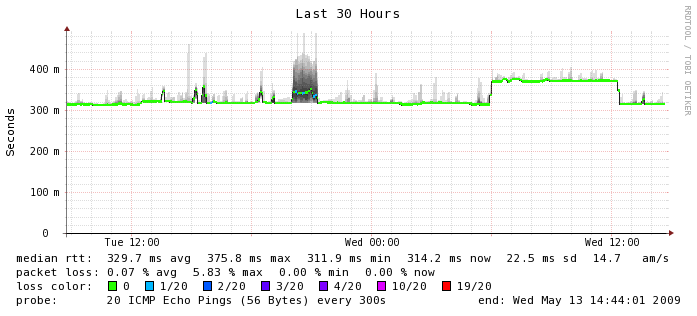
Latency
- Environment: EC2 m1.small
- Datacenter: us-east-1b
- Testing software: smokeping
- Duration: about 20 hours
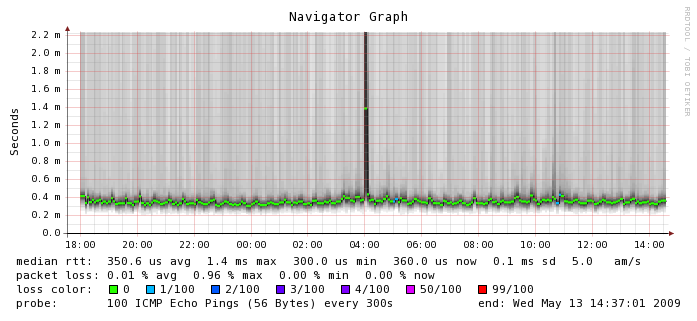
Here, where networking is involved between instances, things start to get a little bit more varied. The median RTT is 0.3506 ms which is about 3 times more latency than you would get on a typical gigabit ethernet network. You can see the numbers hover there for the most part but there is a tremendous amount of variability around that number. Smokeping shows outliers about 2 ms but I have seen numbers as high as 65 ms or worse in ad hoc tests. I don't know what happened at 4 a.m. on this graph but I'm glad I wasn't running a production application at the time. If you look closely, you can also see a few instances of packet loss which is something we don't usually experience on a production network. Again, this is on an otherwise quiescent machine. For comparison's sake, here is the smokeping graph between Terracotta's San Francisco and India office which is actually carrying a fair bit of traffic. This is a LAN to WAN comparison so the numbers are not going to look as exaggerated because they are running on a different scale, but in the EC2 instance, we can see more than 5 times the variability in latency, which we don't see on the WAN segment (or ever on any of my lab switches for that matter).
Bandwidth
- Environment: EC2 m1.small
- Datacenter: us-east-1b
- Testing software: nttcp
- Duration: about 24 hours
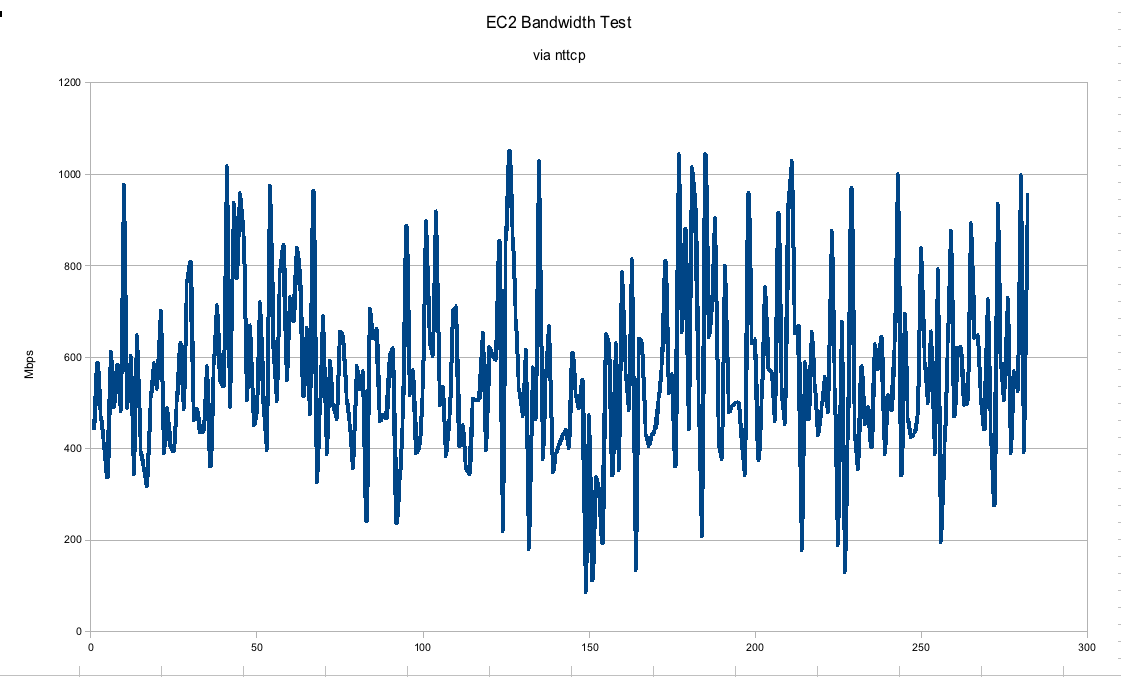
In this graph, we can see that the gigabit connection between EC2 instances is hardly gigabit at all. I would say the numbers may trend upwards of 600 Mbps on average but they fluctuate pretty wildly between real gigabit to barely faster than a 100 Mbps connection. This was run on an otherwise quiescent machine. In a real "production" environment we would expect much more consistency, especially if trying to run performance numbers.
Conclusions
It is pretty safe to say that there won't be any vendors publishing performance numbers of what they are able to achieve with their software running on the cloud unless they had no other choice. You can easily get much more consistent, faster numbers running on dedicated hardware. In our tests with Terracotta, we've seen that you just have to throw that much more hardware at the problem to get the same kinds of numbers. It stands to reason however as a uni-processor m1.small instance is just not going to be as powerful as our quad-core Xeons. In throwing more instances at the problem you start to introduce more of the network into the equation, which as you can see, is a rather variable quantity. Thankfully, the amount of latency introduced even in this case is no big deal for the Terracotta server, so I've been having a pretty good time running bigger and bigger clusters in the cloud.
Posted by Dave Mangot in Applications at 20090513 Comments[5]
Monday March 30, 2009
Linksys WET54G, a consumer product?
I recently bought a consumer electronic device that I wanted to hook up to the Internet. This device came with a hard wired Ethernet port, but of course, I had no Ethernet cable where I needed to hook it up and I also had no desire to run one.
There are various devices on the market that can turn a wired Ethernet jack into a wireless one and the one I choose was the Linksys WET54G.
I chose this device for a few reasons:- All my network devices at home are already Linksys
- Seemed small and priced no higher than any similar devices
- I could get it at my local computer store for the same price as ordering it online
Like most technical folk, I did a lot of reading before purchasing the device. Most of the reviews on Amazon were extremely negative, but I feel like I'm pretty good at sorting through the reviews of the inexperienced vs. the reviews of the knowledgeable. Big mistake!
I got the device and learned that because it is version 3.1 of the product, there are no firmware updates available on the Cisco/Linksys website. It is already a newer revision than anything that is even listed. All that was needed was to plug it in and configure it according to the instructions. Here's what happened.
- Take the bridge (the WET54G is technically a wireless to Ethernet bridge) and plug it into my Linksys mini-hub. Run the Linksys provided utility on a PC (yeah, I still have an ancient XP box kicking around). Bridge not detected. Power cycle the hub and bridge a few times. Nothing.
- Notice that it says the PC and the bridge must be plugged into the same hub. Ohhhh, that must be it. Wire the PC to the hub with a cable. Bridge not detected. Power cycle the hub and bridge a few times, still nothing.
- Ok, I figure, how bad could it be to just use the web interface? I look at the docs and supposedly the bridge will autoconfigure at 192.168.100.121 or some weird address like that. Fine, I reconfigure the NIC on the XP machine and soon am on the web interface for the bridge
- A few minutes later, the bridge is all configured with ip, netmask, gateway etc. I should be good to go. At this point, my PC says "Duplicate IP detected on the network". Hmmm.
- I unplug the PC from the hub and reconfigure everything back to normal (i.e. wireless). The PC is still complaining about duplicate IP and I can no longer ping my default route. Something is fishy.
- I plug my media device into the bridge as had been the plan all along, and the device instantly recognizes the network and says it needs a firmware update. Success! I tell it to get the update and it just hangs there, forever.
- My wife ways that her PC is saying duplicate device detected as well and she can't get on the Internet. Huh?
- Fire up the Mac and I get on the firewall. /var/log/messages tells me that another device on the network is advertising itself as the default route's IP. I check the MAC address and sure enough, it's the bridge!
- I get on the web interface for the bridge and change its default route to a bogus address on the network. Why would my bridge need to get out on the Internet anyway? Instantly, all the devices in the house start working correctly.
- I configure a static IP address on the media device and it is able to access the Internet without problems. I update its firmware through a USB key anyway.
So now the network is running fine and I haven't had any of the other issues people had described in their reviews. But the question remains: How is this a consumer product? I've designed LANs and WANs for multiple companies. I've configured networks on machine all the way on the other side of the world. I was stumped for a good 20 minutes as to why my network was behaving like it was drunk. What would your average gadgethead have done aside from sit on the phone with Cisco tech support for hours? Would they have figured it out? Crazy.
Update: Yesterday my bridge "lost it's mind" and I will have to reconfigure it from scratch. What a piece of junk. Posted by Dave Mangot in Hardware at 20090330
Thursday February 07, 2008
Choosing Zimbra as told to ex-Taosers@groups.yahoo
We're running Zimbra in production and have been for almost a year now. We're running Network Edition (paid) with Mobile.
Eh. It's ok.
Of course our philosophy is to let anyone run anything they want. Zimbra would seem to support this philosophy but I sometimes wonder if it tries to do too much.
Messaging is pretty rock solid. Other than some stupid bugs like showing 20 messages in your Drafts folder and then when you click on it, there is nothing there, it works fine. I've never heard about any lost messages or anything like that.
Calendar is wonky however. You can't set variable reminders for meetings. That means, either get a 5 (or 10, or 15) minute warning for every meeting you have or nothing. So if you have a sales meeting across town that you want to have a 30 minute reminder for, and a budget meeting down the hall you want a 5 minute reminder for, can't do it. It's one of the most voted on bugs in bugzilla and has been for a while, but they say they'll fix it maybe in 5.5. Weird.
Plus, the calendar is just buggy. Meetings don't show up all the time. If you change a meeting time, free/busy gets screwed up. I've had a user whose iSync just stopped putting on new meetings twice. All kinds of headaches.
Of course we support, Blackberrys (via NotifyLink Inc.), Treos, iPhones, Outloook connector, iSync connector. Basically, every bell and whistle you can ring or blow in Zimbra so sometimes it's user error, but sometimes it's Zimbra.
Despite this, I was planning on running Zimbra for mangot.com mail because my wife and I won't have a fit if we miss a meeting. I installed 5.0 and they've changed from Tomcat to Jetty, which is nice, but you still can't bind Zimbra to a single IP without hacking up all the conf files and putting some changes in LDAP. In fact, I had to change my hostname(1) during install temporarily just to get it on the right track. Then I went around hacking up the files to keep it from trying to hog the entire machine.
Of course, Zimbra will tell you that you need to dedicate the whole machine to ZCS. You would think the fact that it uses so many open source components means you could hack on it, but in reality most of your changes will be lost each time you upgrade and you will need to re-apply them (we do exactly that for Mailman integration). Until they get more of the config into the LDAP server, that's just what you're going to have to live with. I guess the fact that is OSS means that's at least an option.
On the plus side, it does have some nice Gee Whiz factor to it and we are talking about setting up a Zimbra server at a remote office that shares the same config as our current one and it's supposed to be very easy, but as with everything else, the devil is probably in the details. Like I said, I'm still planning on running it for my personal stuff, so I don't hate it as much as I might have come across. I don't know if I'd want to run it at my business again, except for the fact that there really is no one else who comes close.
(except Exchange, but we're not an MS-only shop, and please don't give me any of that it runs IMAP garbage, because we all know that's not a real solution)
Cheers, -Dave Posted by Dave Mangot in Applications at 20080207Search This Site
Recent Entries
- DevOpsDays 2012: "Event Detection" Open Space
- DevOpsDays 2012: "Logging" Open Space
- Ode to the External Node Classifier (ENC)
- I'm speaking at Velocity 2012!
- Host-based sFlow: a drop-in cloud-friendly monitoring standard
- Graphite as presented to the LSPE Meetup 16 June 2011
- The Graphite CLI
- Back on the Blog Gang
- A framework for running anything on EC2: Terracotta tests on the Cloud - Part 1
- A Trade Show Booth: Part 2 - The Puppet Config
- Intstalling Fedora 10 on a Mac Mini
- A Trade Show booth with PF and OpenBSD
- EC2 Variability: The numbers revealed
- Linksys WET54G, a consumer product?
- Choosing Zimbra as told to ex-Taosers@groups.yahoo
- Information Security Magazine Chuckle
- A SysAdmin's impressions of MacOS Leopard
- Worlds collide: RMI vs. Linux localhost
- Hello World