 Wednesday May 13, 2009
EC2 Variability: The numbers revealed
Measuring EC2 system performance
I've been spending a lot of time at Terracotta working on cloud deployments of Terracotta and the cloud in general. People have been asking me what the difference is running apps on the cloud, and specifically EC2. There are a number of differences (m1.small is a uni-processor machine!) but the number one answer is "Variability". You just cannot rely on getting a consistent level of performance in the cloud. At least not that I've been able to observe.
I decided to put EC2 to the test and examine three different areas that were easy to measure: disk I/O, latency, and bandwidth
Disk I/O
- Environment: EC2 m1.small
- File size: 10 MB (mmap() files)
- Mount point: /mnt
- Testing software: iozone
- Duration: almost 24 hours

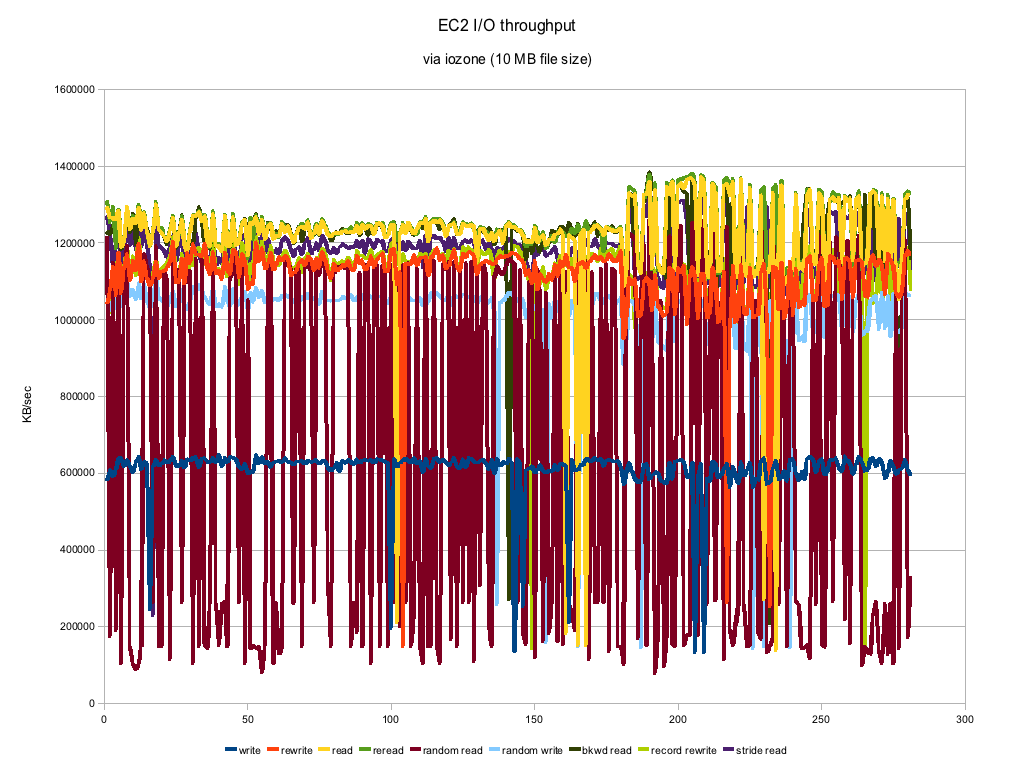
As you can see the numbers can vary a good deal. This is on an otherwise completely quiescent virtual machine and with a 10 MB filesize, the tests themselves took almost no time to run. Most of the numbers actually look remarkably consistent with the exception of Random Reads. Those numbers are all over the place which you might expect from "random" but this looks to be a bit much. The numbers are actually pretty respectable and compare to about a 7200 RPM SATA drive. Certainly not the kind of machine you would use for performance benchmarks, but if you threw enough instances at a clustering problem, you could certainly get the job done.
Latency
- Environment: EC2 m1.small
- Datacenter: us-east-1b
- Testing software: smokeping
- Duration: about 20 hours

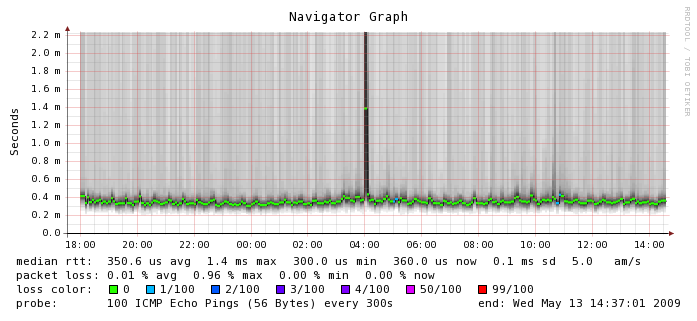
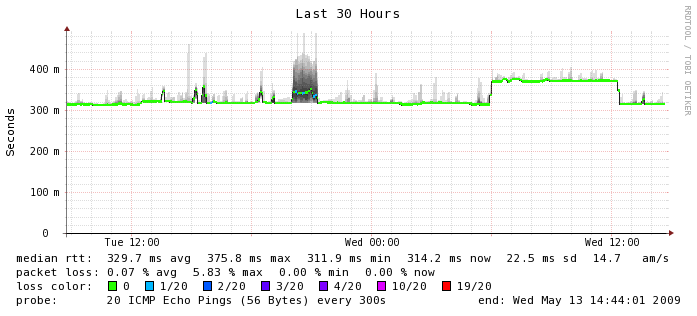
Here, where networking is involved between instances, things start to get a little bit more varied. The median RTT is 0.3506 ms which is about 3 times more latency than you would get on a typical gigabit ethernet network. You can see the numbers hover there for the most part but there is a tremendous amount of variability around that number. Smokeping shows outliers about 2 ms but I have seen numbers as high as 65 ms or worse in ad hoc tests. I don't know what happened at 4 a.m. on this graph but I'm glad I wasn't running a production application at the time. If you look closely, you can also see a few instances of packet loss which is something we don't usually experience on a production network. Again, this is on an otherwise quiescent machine. For comparison's sake, here is the smokeping graph between Terracotta's San Francisco and India office which is actually carrying a fair bit of traffic. This is a LAN to WAN comparison so the numbers are not going to look as exaggerated because they are running on a different scale, but in the EC2 instance, we can see more than 5 times the variability in latency, which we don't see on the WAN segment (or ever on any of my lab switches for that matter).

Bandwidth
- Environment: EC2 m1.small
- Datacenter: us-east-1b
- Testing software: nttcp
- Duration: about 24 hours

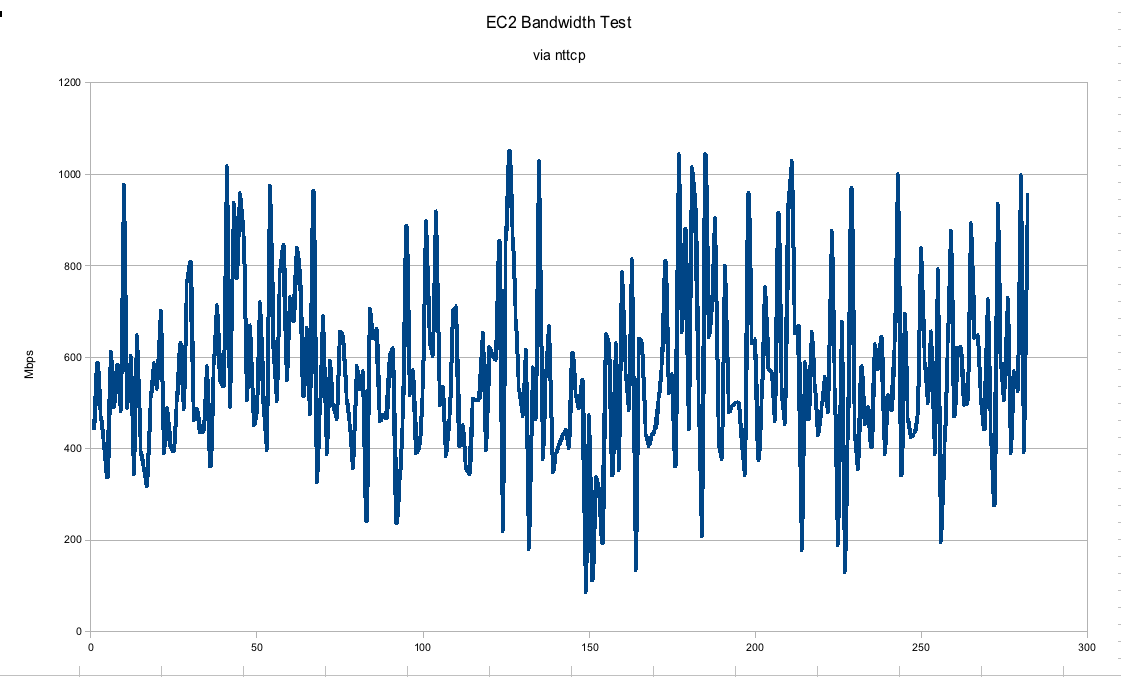
In this graph, we can see that the gigabit connection between EC2 instances is hardly gigabit at all. I would say the numbers may trend upwards of 600 Mbps on average but they fluctuate pretty wildly between real gigabit to barely faster than a 100 Mbps connection. This was run on an otherwise quiescent machine. In a real "production" environment we would expect much more consistency, especially if trying to run performance numbers.
Conclusions
It is pretty safe to say that there won't be any vendors publishing performance numbers of what they are able to achieve with their software running on the cloud unless they had no other choice. You can easily get much more consistent, faster numbers running on dedicated hardware. In our tests with Terracotta, we've seen that you just have to throw that much more hardware at the problem to get the same kinds of numbers. It stands to reason however as a uni-processor m1.small instance is just not going to be as powerful as our quad-core Xeons. In throwing more instances at the problem you start to introduce more of the network into the equation, which as you can see, is a rather variable quantity. Thankfully, the amount of latency introduced even in this case is no big deal for the Terracotta server, so I've been having a pretty good time running bigger and bigger clusters in the cloud.
Posted by Dave Mangot in Applications at 20090513 Comments[5]
Search This Site
Recent Entries
- DevOpsDays 2012: "Event Detection" Open Space
- DevOpsDays 2012: "Logging" Open Space
- Ode to the External Node Classifier (ENC)
- I'm speaking at Velocity 2012!
- Host-based sFlow: a drop-in cloud-friendly monitoring standard
- Graphite as presented to the LSPE Meetup 16 June 2011
- The Graphite CLI
- Back on the Blog Gang
- A framework for running anything on EC2: Terracotta tests on the Cloud - Part 1
- A Trade Show Booth: Part 2 - The Puppet Config
- Intstalling Fedora 10 on a Mac Mini
- A Trade Show booth with PF and OpenBSD
- EC2 Variability: The numbers revealed
- Linksys WET54G, a consumer product?
- Choosing Zimbra as told to ex-Taosers@groups.yahoo
- Information Security Magazine Chuckle
- A SysAdmin's impressions of MacOS Leopard
- Worlds collide: RMI vs. Linux localhost
- Hello World
It seems to me that one way to think about the variability you experienced is to decompose it in to:
1) variability due to virtualization (machine, network, disk sharing), present in any virtualized infrastructure under load.
2) additional variability due to being in the "cloud" of someone else's hardware, i.e. beyond what you would see in an in-house virtualization deployment.
I wonder how much of what you experienced was due to #1 vs #2.
Posted by Kyle Cordes on May 14, 2009 at 05:02 AM PDT #
We have performed performance tests between EC2 instance (for a week) and m1.small instances have the strongest variations for our cpu, disk and memory load tests. It is no surprise since Amazon can put more m1.small instances onto one hardware server than larger instances. We think that you get much better performance and more constancy for the buck with c1.medium.
Our instance comparison:
http://www.paessler.com/blog/2009/04/03
Then we took the concept of cloud monitoring to the next level with http://www.cloudclimate.com: CloudClimate displays the current performance of selected cloud hosting providers. Using our network monitoring software PRTG Network Monitor we monitor the performance of cloud hosting services Amazon EC2 (US), Amazon EC2 (EU), GoGrid CloudServers, and Newservers.
When you look at the graphs you will notice that especially our test system at NewServers has almost no variations. NewServers does not use virtualization - if you purchase a server you actually get your own blade of a blade center server. This fact is the reason for the constancy of our cpu and disk measurements.
Posted by Dirk Paessler on May 15, 2009 at 01:11 AM PDT #
We have performed performance tests between EC2 instance (for a week) and m1.small instances have the strongest variations for our cpu, disk and memory load tests. It is no surprise since Amazon can put more m1.small instances onto one hardware server than larger instances. We think that you get much better performance and more constancy for the buck with c1.medium.
Our instance comparison:
http://www.paessler.com/blog/2009/04/03
Posted by Dirk Paessler on May 15, 2009 at 01:12 AM PDT #
Then we took the concept of cloud monitoring to the next level with http://www.cloudclimate.com: CloudClimate displays the current performance of selected cloud hosting providers. Using our network monitoring software PRTG Network Monitor we monitor the performance of cloud hosting services Amazon EC2 (US), Amazon EC2 (EU), GoGrid CloudServers, and Newservers.
When you look at the graphs you will notice the same level of variations for EC2 instances as you have measured:
Detailed graphs for EC2 US: http://www.cloudclimate.com/ec2-us/
You will also notice that especially our test system at NewServers has almost no variations. NewServers does not use virtualization - if you purchase a server you actually get your own blade of a blade center server. This fact is the reason for the constancy of our cpu and disk measurements.
Posted by Dirk Paessler on May 15, 2009 at 01:15 AM PDT #
Dirk,
Thanks for the information about CloudClimate. I know Hyperic has something similar. In the graphs above I was measuring connectivity between instances on the same cloud because I was trying to determine the suitability of the cloud for a compute grid type (or session clustering, or distributed cache, etc..) scenario that we can use with Terracotta.
In the link you posted about your EC2 graphs, you do monitoring of "Inter-Cloud HTTP Requests: ... the performance of the Internet network connectivity for the cloud servers by performing HTTP requests between all cloud systems every 30 seconds...For an ideal server and network environment the measured times should be constant over time. Spikes in the graph are caused by network latencies or connectivity problems."
Maybe I don't understand the idea of talking about ideal network environments when your traffic is traveling over the Internet. The wild Internet is far from an ideal networking environment. You aren't measuring anything about the cloud in this case. You're measuring the performance of the different ISPs the traffic traverses between the clouds. I guess I just don't understand the point of taking such a measurement. (other than, because it's there).
Thanks for the info. I will definitely check out NewServers.
Cheers,
-Dave
Posted by Dave Mangot on May 15, 2009 at 12:07 PM PDT #