 Wednesday March 02, 2011
Wednesday March 02, 2011
Wednesday March 02, 2011
As part of working on a large scale website like Tagged we are constantly exploring new technologies to see what might be advantageous to help with the site. Whether it's exploring NoSQL technologies, new storage or server hardware, or visualization tools, there is no shortage of software and hardware to try.
Recently, we've been trying out the Graphite Realtime Graphing system. It started as an experiment during our latest Hackathon, and the more we've tried it, the more things there are to like. Because the current Graphite documentation doesn't include a CLI tutorial, I thought it might be nice to write one.
One of the first things you notice when using Graphite is how powerful
and flexible its graphing system is. Sometimes I feel like Tom
Cruise in the "Minority Report" being able to have complete control
over the way I manipulate and visualize my data. One of the great
things (I guess if you're a Unix geek) about Graphite is that it also
comes with a CLI.
To access the CLI, simple point your browser at
http://yourgraphiteinstall/cli or just click the link on the top of
the regular composer window. You will be presented with a prompt like
this:
If you haven't logged in yet (here I am logged in as "admin"), simply
type 'login' at the command prompt and you will be taken to a screen
where you can login to Graphite. Without being logged in, we will be
unable to save our views, which we will get to a bit later.
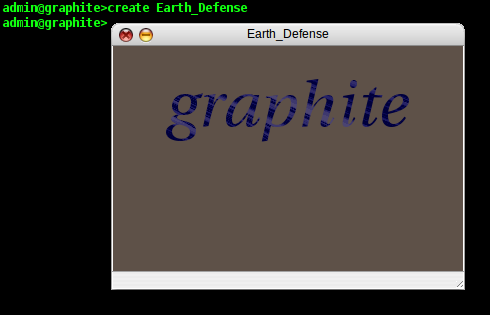
While we can simply begin drawing graphs, right inside the actual
cli, I prefer to draw them inside windows. This way, if you create
multiple windows and save them as a view, you can move them around,
resize them, etc, independently of one another. To create a new
window, type 'create windowname' and it pops up on your screen:
Now we have somewhere to plot our data. For the purposes of this
tutorial, we have populated our datastore with some fictionalized data
about some Earth defense stations that are using their lasers to blast
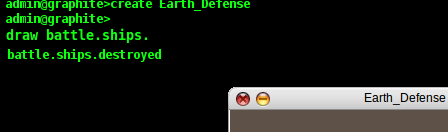
invading ships out of the sky. Now we are going to plot how the
individual stations are doing. In reality, this data can be anything
that you can get into Graphite (networking data, number of users on a
site, temperature, stock prices, etc). In the CLI, I type 'draw
battle.ships.' and as I type, Graphite automatically shows me below
the cursor all the possible completions for my namespace as I
type:
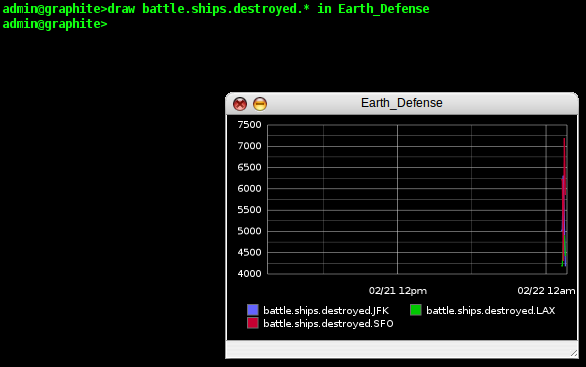
One of the nice things about using a CLI is that I can use
wildcards, so for this example, I type 'draw battle.ships.destroyed.*
in Earth_Defense' and Graphite shows me my data in the window on a
smart looking graph. It has automatically matched all the different
parts of my namespace and plotted them individually on the graph (in
this case, SFO, JFK, and LAX).
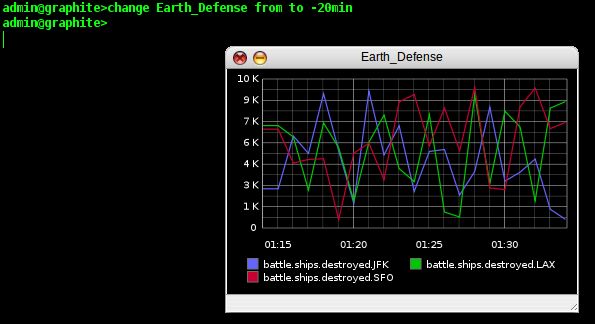
That's pretty nice, but it's difficult to see how the individual
battle stations are doing because we've only recently been getting our
reports in from the stations. So, we need to change the timescale of
our graph. In the CLI, this is trivially easy. We type 'change
Earth_Defense from to -20min' and the timescale on our window is
updated instantly.
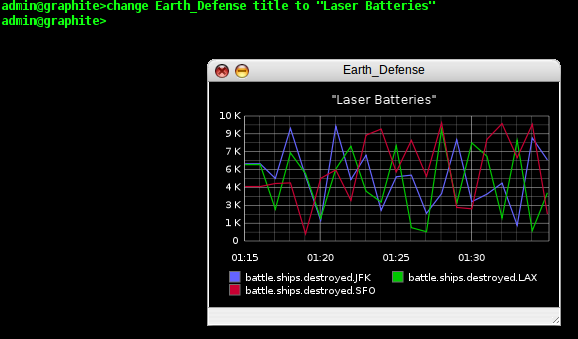
If we are going to send these reports to our superiors, they might
not be as tuned into our data collection methods as we are, so let's
add a title to our graph. We type 'change Earth_Defense title to
"Laser Batteries"' and Graphite updates our graph once again.
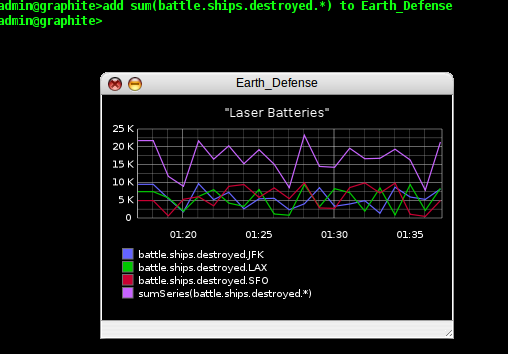
That is just one example of a way we can manipulate a graph in the
CLI, but in reality, we can not only change the chrome of our graph,
but also work with the data itself. Maybe the generals in charge our
our battle don't care about the individual battle stations, they want
to know about the total number of ships destroyed minute by minute.
So let's give them a total they can see on the graph. We type 'add
sum(battle.ships.destroyed.*) to Earth_Defense' and our total
kills now appears on the graph:
There are lots more things we can do with the CLI, and many more
manipulations we can do on our graphs, but for now, we want to be able
to save our graph, so that we can return to it later. In the CLI
this is called a "view". You can have multiple windows/plots saved
in a view, but we are going to save our view now by typing 'save
laserreport'.
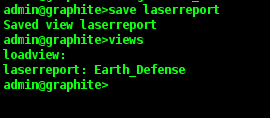
If at some point in the future, we wanted to get this report back, we
could simple type 'views' to get a list of all the different
saved views, followed by 'load viewname' to actually retrieve
the report.
Of course having an easy to use CLI like graphite also allows us to do other powerful things. Having a CLI is almost like having a basic API, so we can actually script what we will cut and paste into our CLI in order to automate repetitive actions. We'll use this Ruby script as a basic example.
#!/usr/bin/ruby

graphite = { "Apple" => "AAPL", "Google" => "GOOG", "Visa" => "V" }
graphite.each { |key, value| puts "create #{key}\ndraw stocks.#{value} in #{key}\n" }
Here we take a hash with information about our window titles and iterate through a list of stock quotes we have in our Graphite installation. You can imagine the possibilities this can give you. Here's the output:create Visa draw stocks.V in Visa create Google draw stocks.GOOG in Google create Apple draw stocks.AAPL in Apple
Graphite is an exciting tool that is becoming easier to use and more capable with every release. Currently we're trying to see how it compares to the tools that we have internally (like you can see here). There are a number of compelling attributes to both tools and it may be the case that one tool will not be the best fit for all cases. In the few short weeks we've been experimenting with Graphite, at the very least, it's proven to be a great addition to the sysadmin's toolbox.
Posted by Dave Mangot in Applications at 20110302 Comments[2]Search This Site
Recent Entries
- DevOpsDays 2012: "Event Detection" Open Space
- DevOpsDays 2012: "Logging" Open Space
- Ode to the External Node Classifier (ENC)
- I'm speaking at Velocity 2012!
- Host-based sFlow: a drop-in cloud-friendly monitoring standard
- Graphite as presented to the LSPE Meetup 16 June 2011
- The Graphite CLI
- Back on the Blog Gang
- A framework for running anything on EC2: Terracotta tests on the Cloud - Part 1
- A Trade Show Booth: Part 2 - The Puppet Config
- Intstalling Fedora 10 on a Mac Mini
- A Trade Show booth with PF and OpenBSD
- EC2 Variability: The numbers revealed
- Linksys WET54G, a consumer product?
- Choosing Zimbra as told to ex-Taosers@groups.yahoo
- Information Security Magazine Chuckle
- A SysAdmin's impressions of MacOS Leopard
- Worlds collide: RMI vs. Linux localhost
- Hello World
Broken link:
http://http//about-tagged.com/news/monitor should be http://about-tagged.com/news/monitor
Posted by 127.0.0.1 on March 03, 2011 at 02:51 AM PST #
Fixed, thanks!
Posted by Dave Mangot on March 03, 2011 at 10:01 AM PST #